
20230306_persist_mfp_pushdown.md 19 KB
- Feature name: Persist Filter Pushdown
- Associated: https://github.com/MaterializeInc/database-issues/issues/3657
Summary
Queries against large collections in Materialize can be very expensive: readers generally need to fetch all the data in the collection as of the query time, even if they're only interested in a small subset. By pushing down filters into the Persist source, we can dramatically improve performance for certain subsets of queries, especially those that filter down to a narrow window of time.
Motivation
Unlock append-only sources for customers via temporal filters. Right now, using an append-only SOURCE in Materialize is painful because MATERIALIZED VIEW restart times increase without bound as data accumulates. However, if there is a temporal filter to bound the size of the dataflow's input data (e.g. the last 30 days of data), we may be able to use the described optimization to similarly bound the restart times.
This technique is not limited to temporal filters or sources. In fact, the optimization will be picked up anywhere we can apply it. However, we're hoping to focus on polishing the subset relevant to append-only sources in the first version of this shipped to customers.
Explanation
Schemas
A Schema trait will be introduced to map data back and forth between Persist columns. Any Rust type
that is to roundtrip through Persist must have a corresponding Schema.
Each column in a RelationDesc is mapped to a column that persist understands: a name, a type, and override-able logic for computing aggregate statistics of columns of that data. The set of supported types is a subset of Apache Arrow's data types, which is then internally mapped to Parquet.
Part Statistics
When Persist writes a batch to Blob storage, it will compute basic statistics over its columns, when possible, and write this data alongside existing metadata in Consensus. To start, we will collect a column's non-null min and max values and null count. We may also track the min/max Row within the part.
Statistics are optional: Persist may not be able to compute min/max values for all types, and we may need to trim statistics to keep metadata from getting too big (more details in the Reference section below).
Filtering
Our compute layer pushes a MapFilterProject operator into the Persist source, which can filter and transform data before emitting it downstream.
Before each batch part is fetched from Blob storage in persist_source, the source will use our new part statistics to analyze whether that MFP will filter out all the rows in that part.
If so, we get to skip fetching the part from Blob storage entirely.
This requires that we have some way to figure out what an MFP's MirScalarExprs might return given only basic information like the nullability and range of values. For more on how that can be done, see the section on filtering parts.
Not all parts may have statistics, and those statistics may not be complete. When stats are not present, this analysis needs to be conservative: if we don't have statistics for a column, we'll assume it might contain any legal value.
Filtering & Locality
Having column statistics is a necessary building block to filter out parts before fetching them, but it is not guaranteed to be effective in actual queries unless there is some degree of locality to the filtered column values across parts in Blob storage. (If the data that matches our filter is evenly distributed across parts, we'll end up needing to fetch every part no matter how clever our analysis is!)
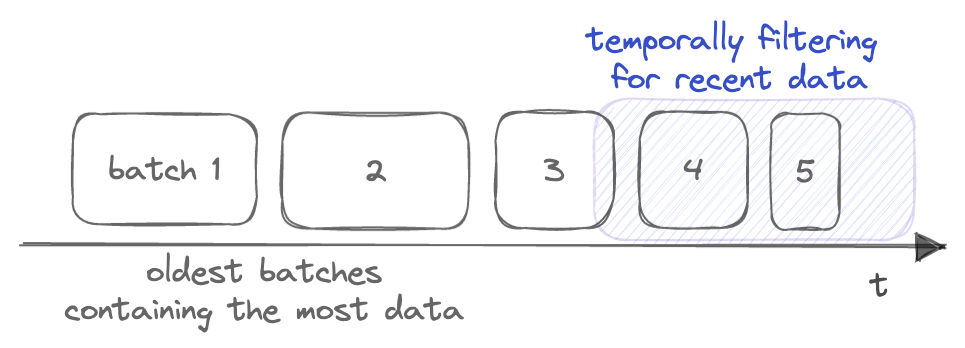
In our first implementation, we plan to focus on temporal filters: ie. filters on columns that are correlated with wall-clock time. These filters tend to have very good locality, thanks to how Persist ingests and compacts data over time -- the newest, and typically smallest, parts will contain the most recent updates, allowing one to filter out the older/larger parts and their data effectively. This is particularly effective for fetching recent data from append-only sources; we'll often have accumulated considerable numbers of older, larger parts that are no longer relevant to the filter.
Reference explanation
Calculating statistics
All statistics are stored in persist State, along with the other metadata about a batch and its parts. We might keep statistics at a part level, or a batch level, or (because it is possible to union the statistics as we have defined them below) both. In the future, we might explore keeping select statistics in Blob and storing only a pointer to them in State. This would allow us to keep much larger statistics, but may not end up being necessary.
For all nullable ColumnTypes, we track the number of null values. For fixed length ScalarTypes, we compute the min and max of the column. For variable length types, such as String and Bytes, we compute (possibly truncated) lower and upper bounds to keep the size of the stats bounded.
For compound types, such as Record, List, or Jsonb, we need to keep stats for individual elements. Using Jsonb as an example:
ScalarType::Jsonbmeans the Datum can be any ofJsonNull,False,True,Numeric,String,List, orMap.ListandMaprecursively containDatums that can be any of the above.- Any of part of this can mix the above types. Concretely: the top level
Datummight be a Numeric in oneRowof a part and aMapin another. Similarly, the top levelDatumin twoRows might be aMapin both, but have a different set of keys, or both have the same keyabut it maps to different types in each. - Even in the initial version of this feature, we have customers that would like to push down filters that use the
->operator onjsonbobjects/maps.
As a result, we end up with the full stats being recursive and looking something like this (simplified here for clarity):
struct LowerAndUpperBounds<T>{lower: T, upper: T};
struct JsonbStats{
    json_null_count: usize,
    bools: Option<LowerAndUpperBounds<bool>>,
    numerics: Option<LowerAndUpperBounds<Numeric>>,
    strings: Option<LowerAndUpperBounds<String>>,
    lists: Option<Vec<JsonbStats>>,
    maps: Option<BTreeMap<String, JsonbStats>>,
};
This, of course, can explode to unbounded size given a sufficiently adversarial user. See the next section.
Statistics trimming
Because statistics are stored in metadata, it is desireable to keep a bound on the size of them. Even if we guarantee that each individual column's statistics are of bounded size, we could have any number of columns. If we had perfect knowledge at statistics calculation time of which columns would be queried, this is much easier, but one of the benefits of this feature is that it works without configuration and also enables exploratory queries. So, ideally we don't require the user to declare this up front.
There are a number of options here, including machine learning models, but simple heuristics are understandable and can get us surprisingly far. It is difficult to predict exactly what the heuristics will be, but an initial thought is something like the following:
- First, a budget (in bytes) is calculated, possibly as a function of how many updates are in the part. We guarantee that the resulting statistics fit into this budget.
- Second, anything obviously unnecessary is trimmed. For example, any real query filtering on a json column is likely to have a cast in the expression tree. This means that many (all?) json stats computed on a column containing more than one Datum type (e.g. both
NumericandString) would output an error from MFP evaluation for something in the part. As a result, the stats would never allow us to filter this part and thus can be trimmed. - Third, we can adjust truncation of stats over varlen columns. For example, a bound of
a<huge string>..=y<huge string>can likely be shortened toa..=z. This does make the bounds less tight, which increases false positives. - Finally, we can trim stats for
Record,List, orJsonbelements or even for entire columns. Note that if we do this, we almost certainly want some way for the customer to be able to hint that a certain column is critical and should never have trimmed stats (possibly even something as simple as a LaunchDarkly flag).
Note that it is expected that the common case will be that stats do not need trimming. This is more a safety measure.
Filtering parts
Thanks to our part statistics, we might know the range of possible values any particular column may have.
To decide whether we can filter a part or not, though, we need to know the range of possible values of the output of the MFP's filter: if we can prove that the filter will never return true or an error value, it's safe to skip the entire part.
Using the range of possible input values to compute the range of possible output values is a well-known static analysis problem, and it's commonly solved via abstract interpretation. In practice, this involves:
Choosing an "abstract set" to approximate your data type. For part filters, we can use roughly:
/// Approximating a range of possible non-null datums.
enum Values<'a> {
  Empty, // No non-null datums.
  Within(Datum<'a>, Datum<'a>), // An inclusive range.
  All, // Includes all datums.
}

/// Approximating a set of possible `Result<Datum, Err>`;
/// ie. the result of `MirScalarExpr::eval`.
pub struct ResultSpec<'a> {
  nullable: bool, // Could this result be null?
  fallible: bool, // Could this result be an error?
  values: Values<'a>, // What range of non-null values may be included?
}
This is meant to be compact enough to compute efficiently, but still precise enough to produce interesting results for many expressions.
Writing an "interpreter" - for every possible expression, we need to be able to evaluate that expression as an instance of our
ResultSpec. (As compared to the normal concrete interpreter, where the expression is evaluated as an ordinaryResult.)Literals are interpreted directly: eg.Datum::NullbecomesResultSpec { nullable: true, ..}.- For
Columns, we know the set of possible values from the statistics. ForUnmaterializableFuncs likemz_now(), we can also provide a range of possible values up front. - The various
Funcs are the tricky case: given an arbitrary function, there's no way to compute theResultSpecof possible outputs from theResultSpecs of the inputs. However, if we know the function is monotonic, then we can map the input range to an output range just by mapping the endpoints! Conveniently, nearly all the functions that are relevant to temporal filters are monotonic in at least one argument: arithmetic, casts,date_trunc, etc. We propose annotating these functions with amonotonicannotation so they can be correctly handled by our interpreter. (To be conservative, we assume un-annotated functions might return any value, including nulls or errors.)
To evaluate an MFP for a particular part in the persist source, we:
- Calculate the
ResultSpecfor each column using our stats. - Evaluate the MFP using the machinery above, returning a
ResultSpecthat captures the possible outputs of the filter. - If the filter might return
trueor an error, we keep the part; otherwise, we filter it out.
Filtering JSONB
The above is enough for normal temporal filters.
However, we'd also like to be able to push down queries against nested structures, like JSON.
To be able to tell whether a query like select * from x where (json_field -> 'ts')::numeric < mz_now() matches our part,
we'll need to know the range of possible numeric values in our 'ts' field.
(Or whether there could be any non-numeric values that might make the cast fail.)
We'll introduce another variant in our Values enum to handle this case:
use std::collections::BTreeMap;

enum Values<'a> {
    // For map datums, constraints on individual fields in the map.
    Nested(BTreeMap<Datum<'a>, ResultSpec<'a>>),
    // ...and other variants as above.
}
This is straightforward to populate from the JSON stats mentioned above.
Finally, in our interpreter, we'll need to fetch any field-specific info from the map when we encounter a field-access function like JsonbGetString.
Since there are a small number of these functions, and they tend to be called with constants on the right-hand side,
matching on these functions appears to be fairly straightforward.
This composes well with the more general approach to propagating range information described in the previous section.
In the json_field example above, assuming ts is always numeric in our shard, our interpreter will:
- Match on the innermost-nested expression, the field lookup, and extract the nested stats for our field.
- Apply the cast. Since the cast is monotonic, we'll preserve our range information.
<will compare two ranges, the one computed in the previous step and the known range formz_now, and determine the possible booleans for the overall expression.
As mentioned, due to stats trimming, we may not have statistics for any particular field. To be conservative, we'll assume that a missing field might have any possible value.
Rollout
Testing and observability
Because Persist is so core to Materialize, we get a large amount of test coverage from existing tests. We can additionally write:
- Proptests to verify that all column types that we support statistics on sort equivalently to their Datum counterparts.
- Tests to verify that the new expression interpreter is consistent with
eval.
Persist already has considerable metrics coverage; we should be able to verify the latency and error rate impacts of the feature from our existing metrics. We'll also want to track the positive impacts of the feature, reporting metrics on the number of parts or bytes that are filtered out. The cost of stats can be measured with metrics tracking the amount of time we spend calculating them and how big they are. The former will also be picked up in our continuous production profiling.
Lifecycle
We plan to roll out MFP pushdown behind two feature flags.
- Stats collection: when the collection flag is enabled, stats will be calculated and stored along with the Persist metadata for each part.
- Stats filtering: when the filtering flag is enabled, we'll use any statistics that are present to try and filter out parts in the Persist source.
If the filtering code is incorrect, we risk dropping parts that would have contributed rows to the query, returning incorrect results. Collecting stats also has a performance impact, increasing both the CPU cost of writing to Persist and the size of the resulting metadata. We'll want to ramp these flags carefully, rolling out to individual test accounts and staging long before writing data in prod.
Neither of these flags should have user-visible effects, aside from the performance improvement itself. It should be safe to roll back any breakage just by disabling the flag.
Drawbacks
Collecting statistics and interpreting MFP expressions both require a significant amount of code, and errors could result in incorrect output.
Opting in all shards to stats collection uses CPU and storage (plus added latency to the ingest side) that is wasted if they are not queried in a way that allows us to push down an MFP.
Conclusion and alternatives
TRANSFORM USING has been discussed as another way to enable append-only workloads.
While some use-cases can be addressed with either feature, filter pushdown has the advantage of not altering how the data is written.
We've explored various approaches to extracting part filters from the MFP data, including matching on the top-level structure of the filter. However, real-world temporal filters are often complex: even the basic examples in our temporal filters documentation fairly deep nesting.
Unresolved questions
It is an assumption that temporal filters will be sufficient to unlock append-only sources. Users might have append-only workloads that are not ideally expressed as a temporal filter.
Do we need some mechanism to ensure that a "critical" usage of this feature (an append-only source that is infeasible without it) is not accidentally broken?
Future work
Better support for non-temporal filters
This document has focussed on temporal filters, particularly for append only datasets.
However, we also believe that we can effectively push down filters on a prefix of the (key, value) columns.
This is due to how parts within Persist are sorted
by (key, value, ts) in column/lexicographic ordering. In practice, the default column order is unlikely to
be immediately useful for most collections, and column ordering would likely need to be user-specifiable
to take full advantage of this property.
Columnar on-disk format
Now that we understand the schema of the data being written to Persist, we could push that structure all the way down to the Parquet storage layer. While this unlocks a number of possible optimizations, it does not block filter pushdown, so we plan to take it on as future work.
Projection pushdown
Persist will fetch and deserialize an entire part file, even if certain columns will be filtered out immediately in the source. Breaking out individual dataset columns into individual columns at the Persist layer will make it possible to avoid fetching or deserializing them at query time.
Logical Sharding
By enabling faster / more selective reads, we additionally open up higher-level ideas like logical sharding, where we store the data of many collections in a single physical shard. An example of this could be our existing system tables -- rather than dedicating a Persist shard to each one, we could use a single physical shard and rely on MFP pushdown to reduce reads to (mostly) only fetch data for individual system tables. Doing so could vastly reduce the cost of small shards, particularly in their load on CRDB and PUT cost to S3, with minimal impact on read performance.
Schema evaluation
Understanding schemas at the persistent data level gives us a building block to explore schema evolution at the Persist level.
Internal improvements
Columnarizing and summarizing parts may help us improve some non-user-facing aspects of Persist. Proper columnar storage will reduce allocations and memory pressure, and storing statistics may inspire a more long-term scalable solution to how we store metadata. These are problems we know we must stay on top of, and revisiting our storage format should help us frame a long-term vision to solving them.