
20230227_external_introspection.md 6.1 KB
- Feature name: External introspection
- Associated: (Insert list of associated epics, issues, or PRs)
Summary
In this document we will propose a few features related to "external" introspection; that is, introspection by end-users. These features will be exposed in the web UI.
Motivation
It is currently difficult for anyone but the most unusually sophisticated users to debug issues with compute-maintained features: understand the health and stability of their replicas, understand the performance of their queries, and so on.
Explanation
We will explain each proposed feature separately.
Hierarchical dataflow visualizer
This will provide the functionality available now in the memory and
/hierarchical-memory visualizations: visualizing the graph of
operators in a dataflow, including the transfer of data along channels
and the number of records in arrangements.
This will differ from the presently-available GUIs in the following ways:
- It will be externally visible
- The user will be able to dynamically refine the zoom level by clicking (rather than having to scroll down as in the current hierarchical UI)
- We will include scheduling durations alongside the other per-node information (arrangement sizes / channel traffic)
- If possible (TBD) we should figure out how to filter out the error paths.
Mockup: 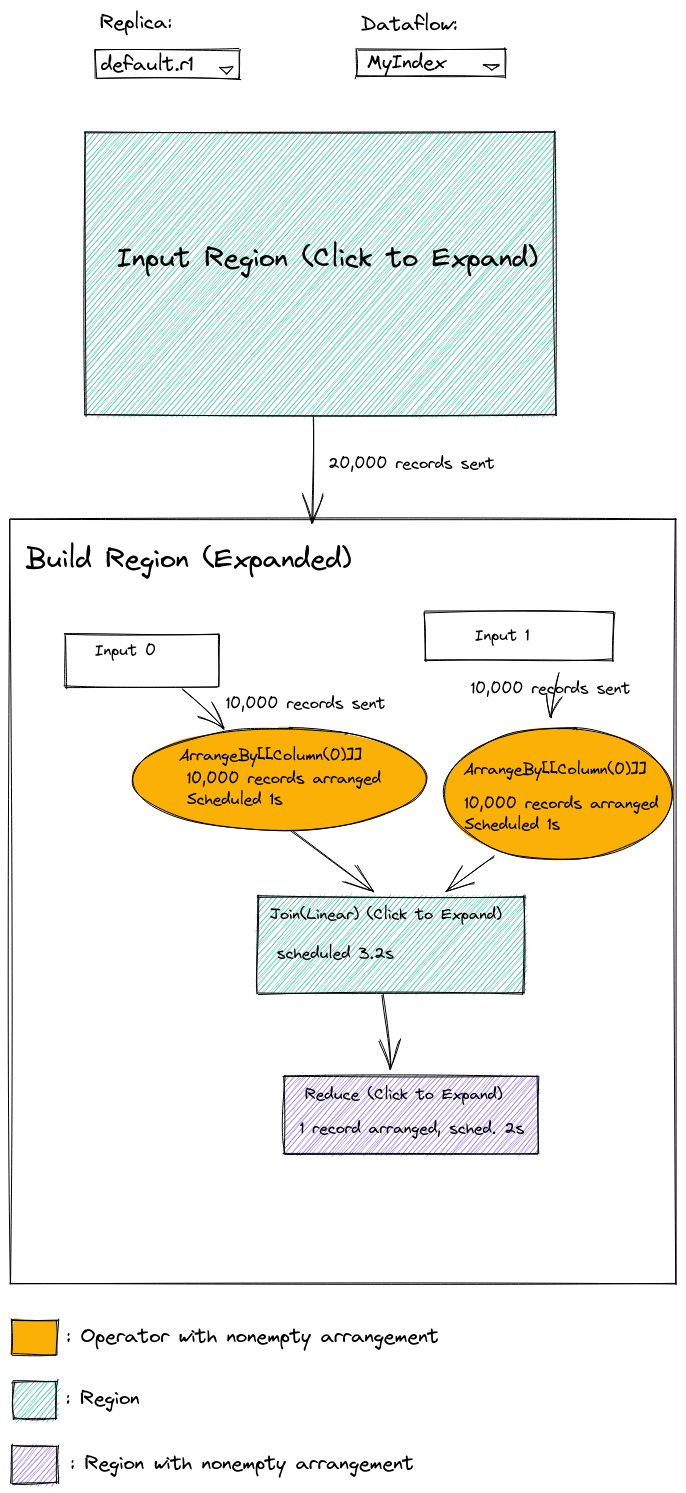
Global frontier lag visualizer
The global frontier lag visualizer will allow users to see at a glance whether dataflows are falling behind. It will display the controller's view of each source and export frontier, and color nodes if their outputs lag significantly behind their inputs.
There may be multiple values corresponding to a single export, if the cluster on which the source dataflow is running has more than one replica. Each edge between dataflows will be labeled with the maximum frontier across all replicas.
The view will incorporate all possible inputs and outputs of a dataflow: indexes, MVs, sources, and sinks.
Mockup: 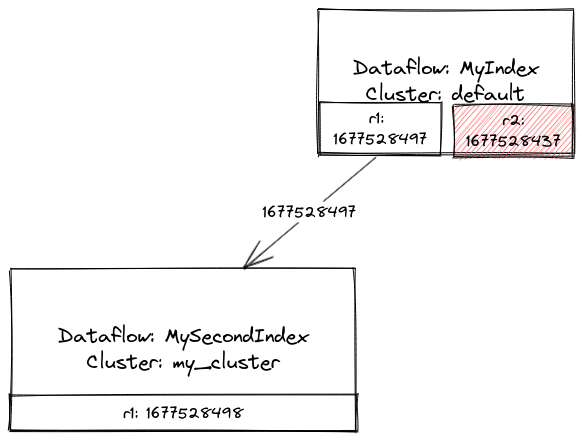
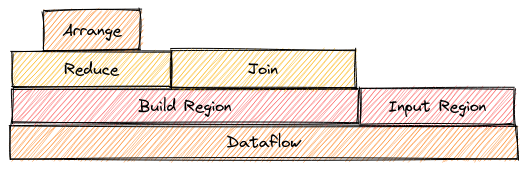
"Flamegraph" views of resource usage information
By "resource usage information" we mean the same things that are displayed per-node in the hierarchical dataflow visualizer.
The scope structure should let us compute various values (time spent, records contained) and display them in a tree-like visualization, as shown below.
Per-query metadata
We should collected the following metadata for each query:
- The timestamp at which the query executed
- The frontiers of all dependencies
- The optimized and physical query plans
- The ID of the dataflow (if it is not a simple peek) used to service the query
- The SQL text of the query
We can then save all this information in a table with non-trivial retention, and surface it from the web UI.
User-friendly rendering of query plans
Currently we have text-only EXPLAIN PLAN output. We should render
this data in visual form, as a graph. We should also (whenever
possible) flow column names from the source relations through the
nodes, so that we can show something more useful than #0, etc.
Reference explanation
Data sources
All features will be implemented in the web UI using React, querying
the mz_internal relations for the necessary data. Relations that
will be used include:
- For the hierarchical dataflow visualizer:
mz_dataflow_operatorsmz_dataflow_channelsmz_arrangement_sizesmz_dataflow_addresses
- For the global frontier lag visualizer:
mz_object_dependenciesmz_cluster_replica_frontiers
- For the flamegraph views: same as the hierarchical dataflow visualizer
- For the per-query metadata: New table to be created
(
mz_query_metadata). - For the user-friendly plan rendering: parsed
EXPLAIN PLANoutput (possibly frommz_query_metadata, or entered manually by the user).
Layout and rendering
We will use the d3-graphviz library for layout and rendering of the hierarchical dataflow visualizer, global frontier lag visualizer, and user-friendly plan rendering. We will use d3-flame-graph -- which we are already using on the internal side -- for the flamegraph visualizer.
Rollout and Lifecycle
We will be considering this an experimental feature until such time as we can involve professional product designers and front-end engineers. Until that time, the level of polish of the UX may not reach the same standards as the rest of the site, so we will require users to click a link with a label like "Advanced Features" or similar in order to access the tools.
We will also use LaunchDarkly to gate access to the feature, and not launch it at all to the public until we have gotten some internal feedback from support and DevEx that it is useful.
We will have a separate LaunchDarkly flag just for the
mz_query_metadata table, since this will have potentially large cost
in high-QPS scenarios.
Testing and observability
(TBD -- will cover this in our meeting with Robin tomorrow and get an overview from him of the testing strategy for this kind of feature)
Drawbacks
- If any of the features don't prove useful, we are cluttering our UX unnecessarily.
- Maintaining the
mz_query_metadatatable will introduce overhead on persist, especially in high-QPS scenarios. We should measure this before implementing.
Conclusion and alternatives
- I am unaware of any other possible designs
Unresolved questions
- What will be the overhead of the
mz_query_metadatatable, and is it acceptable? - How can we communicate query IDs back to the user for looking up the
query in the per-query metadata view? Is it acceptable to use
NOTICEmessages in this case?
Future work
Not sure of any. We should launch an MVP, get feedback and then iterate.